
Learning Objectives
- Know the six major mass extinction events of the Phanerozoic, and recognize that extinctions define major boundaries between time periods
- Describe the effects of the End Permian (P/T) and End Cretaceous (K/T) mass extinctions on biodiversity, including which groups of organisms died and which groups radiated into the vacated niches
- Explain the causes and consequences of the sixth mass extinction
- When provided with a phylogenetic tree with specific evolutionary milestones, use evidence to place an unknown organism with specific, given traits on the phylogenetic tree of life and within the geologic time scale
- Identify whether a group is monophyletic or non-monophyletic and whether a shared trait is homologous or analogous
The Five Major Phanerozoic Mass Extinctions and their Effects on Biodiversity
The information below was adapted from Openstax Biology 47.1.
Changes in the environment often create new niches (living spaces) that contribute to rapid speciation and increased diversity events called adaptive radiations. On the other hand, cataclysmic events, such as volcanic eruptions and meteor strikes that obliterate life, can result in devastating losses of diversity. Such periods of mass extinction have occurred repeatedly in the evolutionary record of life, erasing some genetic lines while creating room for others to evolve into the empty niches left behind. You are already familiar with the extinctions that occurred during the Great Oxygenation event, when cyanobacteria altered the gaseous composition so dramatically that even species that produced oxygen went extinct from the presence of the very same oxygen. While that extinction was probably massive, it is not on the list of five mass extinctions of the Phanerozoic that are well documented in the fossil record.
Before we discuss mass extinctions of the Phanerozoic, first let’s recall the Eras and Periods of this Eon:

Mass extinctions in the fossil record define the geological periods of the history of life on Earth; these mass extinctions typically occur at the transition point between geological periods. The transition in fossils from one period to another reflects the dramatic loss of species and the gradual origin of new species. At five points in the Phanerozoic, a large number of taxa were lost in a short geologic time span:
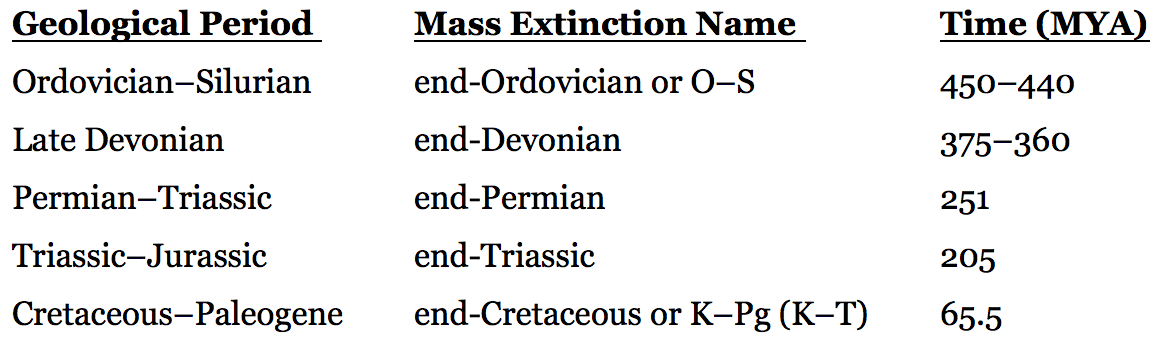

- The end-Ordovician extinction event was the second largest recorded extinction event, when about 85 percent of marine species (land plants and a few groups of animals lived outside the oceans) became extinct.
- The leading hypothesis is that the end-Ordovician extinction was caused by a period of glaciation and then warming in a rapid (1 million year) timespan, affecting both climate and sea levels, and with both the cooling and warming each causing a round of extinctions.
- The end-Devonian extinction appears to have affected primarily marine species and not terrestrial plants and animals. The causes of this extinction are poorly understood.
- The end-Permian extinction (also called P/T or Permian/Triassic) was the largest recorded extinction event so far in the history of life, with an estimated 96 percent of all marine species and 70 percent of all terrestrial species lost.
- Impact on biodiversity: It was at this time that the trilobites, a group that survived the end-Ordovician extinction, became extinct. On land, many seedless plant lineages disappeared, and the disappearance of some dominant species of Permian reptiles made it possible for the dinosaurs to emerge. Terrestrial tetrapod diversity took 30 million years to recover after the end-Permian extinction. The warm and stable climatic conditions of the following Mesozoic Era promoted an explosive diversification of dinosaurs into every conceivable niche in land, air, and water. First lycophytes and later gymnosperms radiated into new landscapes and empty niches, creating complex communities of producers and consumers, some of which became very large on the abundant food available.
- Causes: The causes for this mass extinction are not clear, and it has been called “the unexplained catastrophe.” The leading suspect is extended and widespread volcanic activity that led to a runaway global-warming event. Evidence for this lies in the massive layers of basaltic rock of the Siberian Traps, which indicate extreme volcanic eruptions that lasted for approximately one-two million years. High global temperatures would have resulted from increased carbon dioxide and methane in the atmosphere from the volcanic activity, and warming of ocean water combined with nutrient runoff from dead and decomposing terrestrial species would have caused the oceans to became largely anoxic (devoid of oxygen), ultimately suffocating much of the oxygen-dependent marine life.
- The causes of the end-Triassic extinction event are not clear, and hypotheses of climate change, asteroid impact, and volcanic eruptions have been argued; these hypotheses are not mutually-exclusive. The extinction event occurred just before the breakup of the supercontinent Pangaea, although recent scholarship suggests that the extinctions may have occurred more gradually throughout the Triassic.
- The end-Cretaceous extinction event 65 million years ago was not the biggest extinction event, but it is the most famous because this extinction saw the loss of all dinosaurs except a theropod clade that gave rise to birds. (The end Cretaceous is also called the Cretaceous/Tertiary or K/T; “K” is the traditional abbreviation for “Cretaceous,” and “Tertiary” is a now-obsolete term that describes the Paleogene)
- Impact on biodiversity: Plants died, herbivores and carnivores starved during this extinction event; in fact, every land animal that weighed more than 25 kg became extinct as a result of the end-Cretaceous extinction event. Recovery times for biodiversity after the end-Cretaceous extinction are shorter, in geological time, than for the end-Permian extinction, on the order of 10 million years. As plant biodiversity began to recover in the following Cenozoic Era, the surviving mammals radiated into terrestrial and aquatic niches once occupied by dinosaurs. Birds, descended from the only surviving group of dinosaurs, became aerial specialists. The rapid dominance of flowering plants created new niches for insects, birds, and mammals. Changes in animal species diversity during the late Cretaceous and early Cenozoic were also promoted by a dramatic shift in Earth’s geography, as continental plates slid over the crust into their current positions, leaving some animal groups isolated on islands and continents, or separated by mountain ranges or inland seas from other competitors. Early in the Cenozoic, the evolution of grasses and coral reefs created entirely new ecosystems. Late in the Cenozoic, further extinctions followed by speciation occurred during ice ages that covered high latitudes with ice and then retreated, leaving new open spaces for colonization.
- Causes: The main cause of the end-Cretaceous extinction event resulted from the cataclysmic impact of a large meteorite, or asteroid, off the coast of what is now the Yucatan Peninsula in Mexico. Evidence in support of this hypothesis includes a sharp spike in the levels of iridium (which rains down from space in meteors at a fairly constant rate but is otherwise absent on Earth’s surface) at the rock stratum that marks the boundary between the Cretaceous and Paleogene periods, and an appropriately aged and sized impact crater. At the time, skies would have darkened, and temperatures would have fallen as the meteor impact and tons of volcanic ash blocked incoming sunlight.
The Sixth Major Mass Extinction of the Phanerozoic
The information below was adapted from Openstax Biology 47.1 and Wikipedia “Holocene extinction”
We are currently living in the midst of a sixth mass extinction, caused primarily by the activities of Homo sapiens. The current mass extinction has been called both the Holocene mass extinction as well as the Anthropocene mass extinction. The Holocene Epoch is the name of the most recent ~12,000 years of Earth’s history, or the time since the last major ice age. (Epochs are subdivisions of Periods within geologic time.) Some ecologists have argued that we have transitioned from the Holocene into the Anthropocene Epoch, named for the outsized influence humans are having on the Earth’s climate and ecology; however, the Anthropocene is an unofficial epoch, used to describe Earth’s most recent history beginning the 1950s.
Since the beginning of the Holocene period, there are numerous extinctions of individual species that are recorded in human writings. Most of these extinctions coincide with the expansion of European colonialism beginning in the 1500s. The Holocene/Anthropocene mass extinction has accelerated since that time and is affecting a broad swath of eukaryotic life, including multiple families of plants and animals, including mammals, birds, reptiles, amphibians, fish, and invertebrates, and affecting both terrestrial and marine species. These extinctions are driven by a complex array of factors driven by humans, which include:
- the unprecedented role of humans as a “global super-predator” that affects global ecology by hunting apex predators,
- land use changes for development and farming that displace species from their habitats
- large-scale impacts on the environment including widespread pollution, ocean acidification and global warming
Estimates of Holocene extinction rates are hampered by the fact that most extinctions are probably happening without our even knowing it. Many species, especially invertebrates, may be extinct or on the brink of extinction, without ever having been described by western science. The best estimates of the current species extinction rate are100 to 1000 times higher than the typical background extinction rate. Some researchers estimate that the current extinction rate is 10 to 100 times higher than the extinction rate of any earlier mass extinction experienced in the history of life on Earth.
Apply Your Knowledge to Place Unknown Organisms onto the Tree of Life and in Geologic Time
We began the module by learning how to read phylogenies. In the previous readings in this Biodiversity Module, we’ve noted that key innovations or adaptations arose in lineages and came to define the clade. For example, in the tetrapod phylogeny depicted at this link, all living tetrapods share the trait of five digits, with wrists and ankles turned forward for walking on land. If you were presented with a vertebrate specimen that also had these characteristics, you would logically label it as a tetrapod, and then you could further characterize it using additional characteristics, such as whether it reproduced with an amniotic egg. As this Module wraps up, you now have the additional biodiversity knowledge to place organisms of unknown origin onto the phylogenetic tree of life and into the geologic time scale.
To place an unknown organism within the geologic time scale, first reflect back on the diversity of species from this module and consider when groups first arose and when adaptive radiations occurred in each group. For example, mammals arose in the Mesozoic Era but didn’t radiate until the Cenozoic Era, after the dinosaurs’ extinction at the end-Cretaceous opened up new niches. If we map those radiations to the geologic time scale, we can correlate major earth events with lineage diversification such as the change in atmospheric oxygen over time and changes in global climate.
To help you put this information together in context of other evolutionary events in the history of life on Earth, look back over the previous readings listed below and specifically focus on the sections discussing evolutionary adaptations and evolutionary events in Geologic Time:
- Land Plant Evolution over Geologic Time
- Fungi Evolution over Geologic Time
- Invertebrate Evolution over Geologic Time
- Vertebrate Evolution over Geologic Time
This short PBS Eons video ties together a group’s proliferation or radiation with the major geologic periods, and gives some perspective on both how much we can understand about the history of life using fossils, and how much mystery might remain in the fossil record for the 99% of taxa that have gone extinct already.
