
This page is under revision
Learning Objectives
- Use the movement of continents to explain the current distribution of fossils and living organisms
- Describe changes in climatic conditions over geologic time
- Explain how the climate conditions select for the traits of organisms over geologic time
- Explain evidence for climate change today relative to historical records of temperature and carbon dioxide and predict possible outcomes for species diversity
Continental Drift over Geologic Time Helps Explain Species Distributions
The information below was adapted from Wikipedia “Supercontinent cycle” and Wikipedia “Supercontinent”
So far in our discussions of evolution of life on Earth in geologic time, we have emphasized the evolutionary adaptations within the tree of life that have led to evolution of new lineages resulting in our past and present diversity of life. But over geologic time, not only have species diversity and composition changed, but also the location of the continents themselves have shifted. Continental drift is the very gradual movement, assembly, and rifting of the crustal plates and their associated continents. This process means that when a taxon arose millions of years ago, it probably lived in a different location with respect to the equator and poles, and in a location that may have been connected physically with what are now separate continents.
Due to movement of tectonic plates, the continents move in a “supercontinent cycle,” or a periodic aggregation (coming together) and dispersal (breaking apart) over the course of 300-500 million years. When continents collide, the result is fewer and larger continents; a supercontinent results when all or most continents assemble together.
There have been multiple supercontinents throughout Earth’s history, but here we’ll briefly describe just two of them:
- Rodinia was a Precambrian (Proterozoic Eon) supercontinent that assembled approximately 1.2 BYA, and broke up approximately 750 MYA. Rodinia was located near the Earth’s equator, and its breakup around the end of the Proterozoic is thought to have contributed to climactic conditions that facilitated the rapid evolution of early multicellular life (more on this idea below).
- Pangea was Earth’s most recent supercontinent. It assembled approximately 335 MYA in the late Paleozoic, and began to break apart approximately 200 MYA during the early Mesozoic. Like Rodinia, Pangea was located near Earth’s equator. Assembly of Pangea dramatically affected evolution of life: prior to assembly of Pangea, the smaller continents located near the equator had wet and swampy conditions which favored massive lycophyte forests and amphibians; however, because larger continents tend to have drier climates in the continental interior; the assembly of Pangea resulted in increasingly arid conditions that favored gymnosperms and amniotes.
The short animation below shows the projected movement of continents, based on evidence from the magnetic rock record and other geological clues. As you view it, consider a specific group, such as reptiles, and when they arose and flourished globally.
Climate Conditions Change Over Geologic Time
Another abiotic (nonliving) factor that has dramatically impacted the evolution of life on Earth is climate change over time. We can infer a lot about climate conditions throughout Earth’s history based on evidence in the geologic record. Here we’ll describe three inter-related climate conditions in Earth’s early history: “Snowball Earth,” oxygenation of the atmosphere, and temperature changes over time.
Snowball Earth: Evidence from geology, the oxygenation of the atmosphere, and models of plate tectonics together provide evidence that the Earth was covered with glacial ice sometime preceding 600 MYA during the Proterozoic Eon. The hypothesis for this “Snowball Earth” ties together evidence of the following, not all of which are necessary for a global and long ice age to have occurred:
- Continents located primarily near the equator: Land at the equator reflects sunlight more effectively than open ocean, which maximizes the albedo effect (cooling due to reflected sunlight). While oceans absorb heat from the sun rather than reflect it, land at the equator actually reflects light and heat, preventing surface temperature from increasing. Rodinia was located at the equator prior to its breakup ~750 MYA.
- Excessive production of oxygen: As Rodinia broke up ~750 MYA, its separation created coastal environments with excess availability of mineral runoff into the oceans. Cyanobacteria in the oceans flourished as a result, producing oxygen in excess of the amount that could be sequestered by reactions in the ocean with iron. These reactions formed rock layers with alternating bands of iron-rich sediment. These so-called banded iron formations indicate that oxygen was present in the oceans or seas and reacting with dissolved iron to form iron oxides, which were heavy and sank to the ocean floor.
- Reduction of greenhouse gasses: Once iron and other reactants, like organic carbon, in the ocean became depleted, the excess oxygen eventually accumulated in the atmosphere, where it may have reacted with the “greenhouse gas” methane to form carbon dioxide. The subsequent reduction in methane would have reduced the ability of the planet to retain the reflected light and heat, allowing the surface to cool.
Oxygenation of the atmosphere: No other planet in our solar system has oxygen gas in the atmosphere. Oxygen is highly reactive, and quickly consumed by oxidation reactions. On Earth, oxygenic photosynthesis by cyanobacteria, green plants, and many protists continually replenishes the oxygen consumed by respiration and other oxidative processes (e.g., rusting of iron, weathering of rocks). Evolution of oxygenic photosynthesis changed the planet’s atmosphere over billions of years, and in turn caused radical changes in the evolution of life on Earth. The history of oxygen gas in the Earth’s atmosphere greatly influenced the history of life, as follows:
- Prior to the evolution of oxygenic photosynthesis in early cyanobacteria approximately 2.5 BYA during the late Archean, the early Earth had essentially no oxygen gas (O2) in the atmosphere and all life was anaerobic.
- Beginning ~2.5 BYA at the start of the Proterozoic eon, early cyanobacteria produce oxygen gas as a byproduct of oxygenic photosynthesis in the oceans. This newly produced oxygen is absorbed in oceans and seabed rock by reacting with soluble iron and precipitated iron oxide (rust) from the oceans, generating banded iron formations. Oxygen dissolved in water causes mass extinction of many anaerobic organisms (“oxygen catastrophe”) and allows evolution of aerobic metabolism, which is energetically more efficient, and eventually enables the evolution of the first eukaryotes around 1.6-2 BYA.
- In the mid Proterozoic eon, O2 starts to gas out of the oceans into the atmosphere and is absorbed by land surfaces and formation of ozone layer. The first multicellular eukaryotes evolve, including algae and animals.
- In the late Proterozoic, O2 sinks become saturated and the gas accumulates in the atmosphere. Accumulation of oxygen in the atmosphere facilitates the Cambrian explosion of large and complex multicellular life ~542 MYA, initiating the Phanerozoic eon.
![Image credit: Oxygenation-atm.svg: Heinrich D. Hollandderivative work: Loudubewe [CC-BY-SA-3.0 (http://creativecommons.org/licenses/by-sa/3.0/) or GFDL (http://www.gnu.org/copyleft/fdl.html)], via Wikimedia Commons](https://organismalbio.biosci.gatech.edu/files/2019/01/840px-Oxygenation-atm.png)
Image credit: Oxygenation-atm.svg: Heinrich D. Hollandderivative work: Loudubewe [CC-BY-SA-3.0 (http://creativecommons.org/licenses/by-sa/3.0/) or GFDL (http://www.gnu.org/copyleft/fdl.html)], via Wikimedia Commons
Temperature and sea level: The Earth has experienced large swings in global temperature, from the probable “Snowball Earth” in the Proterozoic to a fluctuation between hothouse and intermittent glaciation, shown below, in the Phanerozoic.
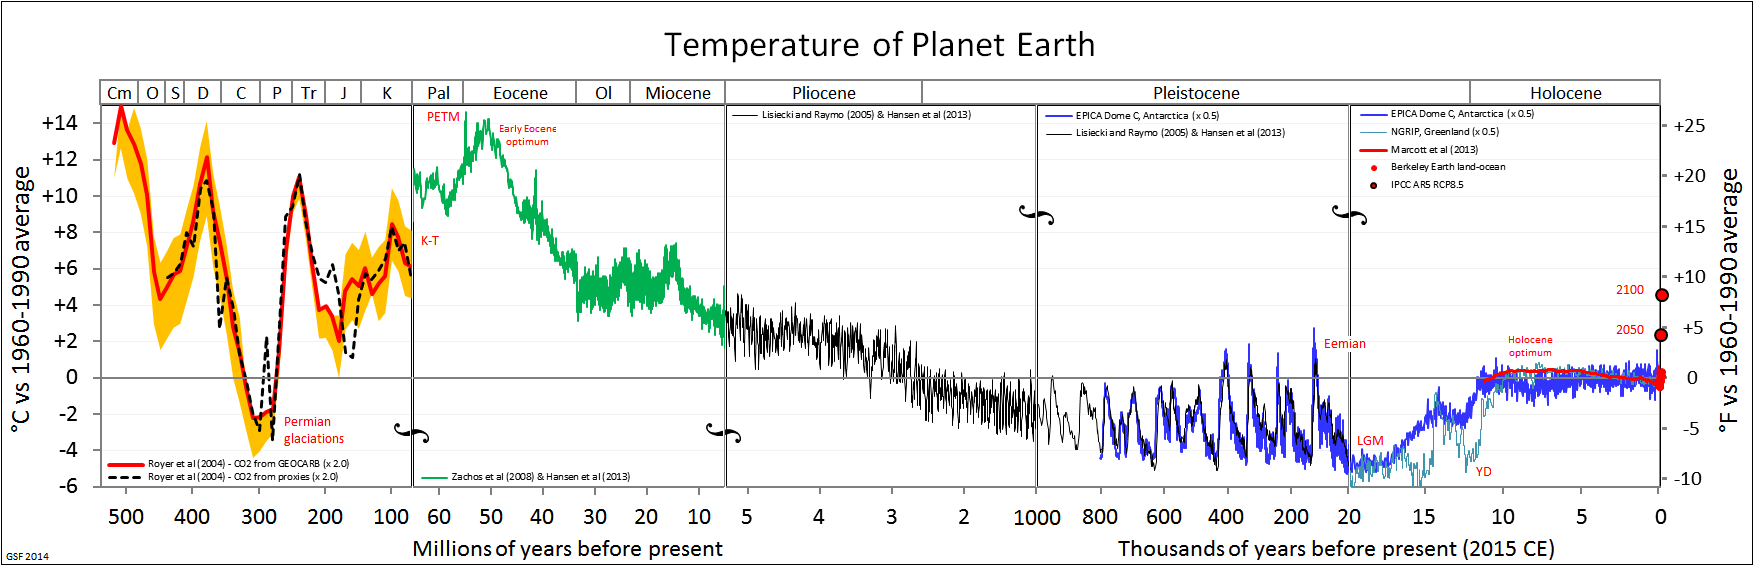
Multiple factors caused these large swings in global temperature, including changes in solar output, extreme volcanic activity, meteor strikes, and atmospheric greenhouse gasses, such as carbon dioxide. Carbon dioxide levels are currently above 400 ppm, the highest it has been for at least the last 14 million years.
Evidence for a Changing Climate Today in the Anthropocene
The information below was adapted from OpenStax Biology 2e 44.5
Today we are transitioning out of the Holocene Epoch and into the Anthropocene Epoch, named for the outsized influence humans are having on the Earth’s climate and ecology. (The Anthropocene is an unofficial epoch, used to describe Earth’s most recent history; in 2023, it was proposed that the Anthropocene began in the 1950s.) The Anthropocene is noted for human-driven climate change. Climate change can be understood by approaching three areas of study:
- drivers of global climate change
- evidence of current and past global climate change
- documented results of climate change
It is helpful to keep these three different aspects of climate change clearly separated when consuming popular media reports about global climate change; it is common for reports and discussions about global climate change to confuse the data showing that Earth’s climate is changing with the factors that drive this climate change.
Climate refers to the long-term, predictable atmospheric conditions of a specific area, while weather refers to the conditions of the atmosphere during a short period of time. To better understand the difference between climate and weather, imagine that you are planning an outdoor event in Atlanta:
- You would be thinking about climate when you plan the event in the fall or spring rather than the summer because you have long-term knowledge that any given Saturday in the months of May to August will likely be hot!
- However, you cannot guarantee temperate and cool weather on any specific Saturday because it is difficult to accurately predict the weather.
A common misconception about global climate change is that a specific weather event occurring in a particular region, like rainstorm in Georgia, provides evidence of global climate change. Instead, a rainstorm is a weather-related event and not a climate-related one. Climate can be considered “average” weather that takes place over many years.
The Earth has gone through periodic cycles of increases and decreases in temperature. The natural drivers of climate change include Milankovitch cycles, changes in solar activity, and volcanic eruptions:
- The Milankovitch cycles describe the effects of slight changes in the Earth’s orbit on Earth’s climate. These range in length between 19,000 and 100,000 years, which are huge time scales relative to human activity.
- Solar intensity is the amount of solar power or energy the sun emits in a given amount of time. As solar intensity increases (or decreases), the Earth’s temperature correspondingly increases (or decreases). Changes in solar intensity have been proposed as one of several possible explanations for the Little Ice Age.
- Volcanic eruptions last a few days, but the solids and gasses released can influence the climate over a period of a few years, causing short-term climate changes, generally cooling the climate. The output of gasses and solids released by volcanic eruptions into the atmosphere can include carbon dioxide, water vapor, sulfur dioxide, hydrogen sulfide, hydrogen, and carbon monoxide. They establish a haze that block out sunlight and triggers climate cooling globally, often lasting one or more years.
None of these factors, however, lead to rapid increases in global temperature or sustained increases in carbon dioxide. For an explanation of the current upward spike in temperatures, we have to look to anthropogenic drivers of climate change. Greenhouse gasses are probably the most significant drivers of the climate. Greenhouse gasses absorb and emit radiation and are an important factor in the greenhouse effect: the warming of Earth due to carbon dioxide and other greenhouse gasses in the atmosphere. The effect works like this:
- When heat energy from the sun strikes the Earth, atmospheric gasses like carbon dioxide, methane, water vapor, nitrous oxide, and ozone trap the heat in the atmosphere, similar to how the glass panes of a greenhouse keep heat from escaping. These gasses also help protect terrestrial species from the DNA-damaging UV from the sun.
- The sunlight radiation that makes it to Earth is converted into thermal (infrared) radiation, and then a portion of that energy is re-radiated back into the atmosphere. However, those same gasses reflect much of the thermal energy back to the Earth’s surface, and the more greenhouse gasses there are in the atmosphere, the more thermal energy is reflected back to the Earth’s surface, heating it up and the atmosphere immediately above it.
The burning of fossil fuels is an important source of greenhouse gasses, which play a major role in the greenhouse effect.
Historic Evidence for Global Climate Change
Since we cannot go back in time to directly measure climatic variables, such as average temperature and precipitation, we instead indirectly measure temperature through historical evidence of Earth’s past climate which can be obtained from air bubbles trapped in Antarctic ice.

The 0°C on the Y-axis of the top graph above (blue) refers to the long-term average. Temperatures that are greater than 0°C exceed Earth’s long-term average temperature, and temperatures that are less than 0°C are less than Earth’s average temperature. This figure shows that there have been periodic cycles of increasing and decreasing temperature in the last 400,000 years. Two significant temperature irregularities have occurred during the past 2,000 years:
- the Medieval Climate Anomaly (900–1300 AD) of 0.1-0.2 °C above normal was a warmer period,
- the Little Ice Age (1550–1850 AD) showed cooling of 1 °C. During the Little Ice Age, the Industrial Revolution (early 1800s) ushered in fossil fuel use. When a fossil fuel is burned, carbon dioxide is released, and atmospheric carbon dioxide began to rise.
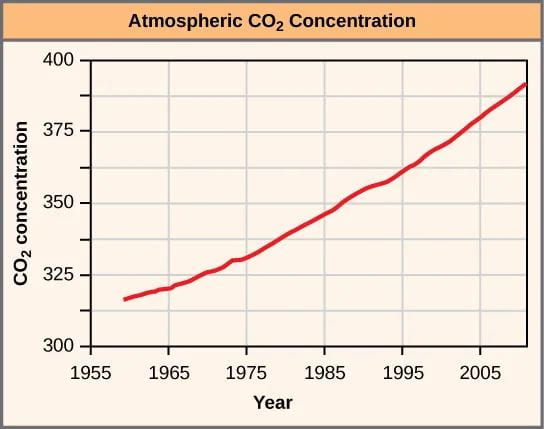
Direct evidence supports the relationship between atmospheric concentrations of carbon dioxide and temperature: as carbon dioxide rises, global temperature rises. Since 1950, the concentration of atmospheric carbon dioxide has increased from about 280 ppm to 392 ppm in 2011.
Scientists look at patterns in data and try to explain differences (or deviations) from these patterns. In historical carbon dioxide patterns, scientists have concluded that it took around 50,000 years for the atmospheric carbon dioxide level to gradually increase from its low minimum concentration to its higher maximum concentration. Since the industrial revolution, atmospheric carbon dioxide concentrations have increased beyond the historical maximum of 300 ppm. The current increases in atmospheric carbon dioxide have happened very quickly—in a matter of hundreds of years rather than thousands of years. What is the reason for this difference in the rate of change and the amount of increase in carbon dioxide? A key factor that must be recognized when comparing the historical data and the current data is the presence and industrial activities of modern human society; no other driver of climate change has yielded changes in atmospheric carbon dioxide levels at this rate or to this magnitude.
Human activity releases carbon dioxide and methane, two of the most important greenhouse gasses, into the atmosphere in several ways. The primary mechanism that releases carbon dioxide is the burning of fossil fuels, such as gasoline, coal, and natural gas (see here). Deforestation, cement manufacture, animal agriculture, the clearing of land, and the burning of forests are other human activities that release carbon dioxide. Methane (CH4) is produced when bacteria break down organic matter under anaerobic conditions. Anaerobic conditions can happen when organic matter is trapped underwater (such as in rice paddies) or in the intestines of herbivores of industrially-farmed cattle. Another source of methane is the melting of clathrates, frozen chunks of ice and methane found at the bottom of the ocean and released as ocean waters warm.
Scientists have geological evidence of the consequences of long-ago climate change, such as the cause of the Permian extinction. Modern-day phenomena such as retreating glaciers and melting polar ice cause a continual rise in sea level. The Grinnell Glacier in Glacier National Park in Montana is one of many examples of the loss of ice on the surface, which is leading to an increase in sea levels.

In addition to changes in temperature, ice, and sea level, organisms are also being affected by the changes in temperature. The geographic distribution is shifting poleward and to areas of higher elevation for many species, and timing of breeding seasons and of animal migrations is shifting. Recent research shows that 385 plant species in Great Britain are flowering 4.5 days sooner than was recorded earlier during the previous 40 years. Insect-pollinated species were more likely to flower earlier than wind-pollinated species. The impact of changes in flowering date would be mitigated if the insect pollinators emerged earlier. This mismatched timing of plants and pollinators could result in reduction of plant populations because insect-pollinated plants rely on their pollinators for successful reproduction.
The Khan Academy video below on the Proterozoic Eon below reviews many of the ideas discussed in this reading:
And here’s a PBS Eons video with an overview of oxygen, diversification, and extinction, which makes a nice bridge to the reading for next time on mass extinctions:
