
This page is under revision
Learning Objectives
- Label the roots, nodes, branches, and tips used in phylogenetic trees and their interpretation, and avoid common misconceptions in interpreting phylogenetic trees
- Distinguish the different types of data used to construct phylogenetic trees
- Distinguish monophyletic and non-monophyletic groups, and identify shared, derived traits that identify a monophyletic group
- Identify and use the most recent common ancestor (MRCA) to evaluate the relatedness of taxa
- Define and recognize features of adaptive radiations
Biological Diversity is Represented in Phylogenetic Trees
Biological diversity is the topic of this module. All organisms that ever existed on this planet are related to other organisms in a branching evolutionary pattern called the Tree of Life. “Tree thinking,” or phylogenetic thinking is essential to decipher this relatedness between the diversity of organisms, both living and extinct. Tree thinking helps us unravel the branching evolutionary relationships between extant species, while also recognizing the passage of time and the ancestors of each of those living species.
A phylogenetic tree is a visual representation of the relationship between different organisms, showing the path through evolutionary time from a common ancestor to different descendants. Trees can represent relationships ranging from the entire history of life on earth, down to individuals in a population. Trees that show species help us understand how new species form from common ancestral species. The process of new species formation, called speciation, is the starting point for a discussion of biological diversity. The natural endpoint will be extinction.
Terminology Used to Describe and Interpret Phylogenetic Trees
The diagram below shows a tree of 3 taxa (singular taxon, also known as a taxonomic unit). A biological taxon is one or more populations of organisms that form an evolutionary meaningful unit. A taxon might be a domain (e.g., Eukaryota), a kingdom (e.g., Animalia), a Phylum (e.g., Chordata), a class (e.g., Mammalia), an order (e.g., Primates), a family (e.g., Hominidae), a genus (e.g., Homo), a species (e.g., Homo sapiens), one or more populations within a species, or even an individual gene.
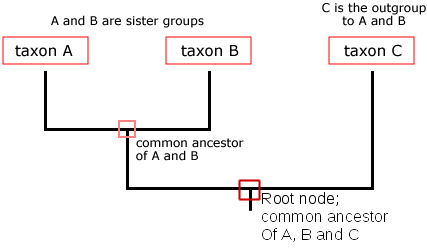
Notice that the tree above branches from a single trunk into two branches, the vertical lines, and then the left side branches again. In this tree, the vertical branches represent a lineage, or taxon, shown at the tip, and all its ancestors. The nodes are where lineages diverge, representing a speciation event from a common ancestor. The trunk at the base of the tree is called the root, and the root node represents the most recent common ancestor of all of the taxa represented on the tree. Time in this particular style of tree is represented vertically, proceeding from the oldest pictured here at the bottom to the most recent at the top. The common ancestor of taxon A and B is represented in the small red box labeled “common ancestor of A and B.” A group of taxa that includes a common ancestor and all of its descendants is called a clade, or a monophyletic group (“mono” = “one”). The least related taxon in a tree is called the outgroup of that phylogeny, and it is often included because it has contrasting characteristics relative to the other included taxa.
The video below focuses on terminology and explores some misconceptions about reading trees:
Phylogenetic Tree Misconceptions and How to Correctly Read a Phylogenetic Tree
Trees can be confusing to read. Below we list some common misconceptions and how to correct your thinking:
- Misconception: you can identify relationships by reading across the tips. One very common mistake is to read “across the tips” of the trees and think the order of the tips has meaning. In the image below, the closest relative to the star is not the square. In the tree show below (also at the top of this page), the closest relative to taxon C is not taxon B. Both A and B are equally distant from, or related to, taxon C. In fact, switching the labels of taxa A and B would result in a topologically equivalent tree. It is the order of branching along the time axis that matters.
The illustration below shows that one can rotate branches and not affect the structure of the tree, much like a hanging mobile; in other words, all three trees below show identical relationships because the topology (branching patterns) are the same, even though the order across the tips is different:

- Misconception: everything represented in the tree is also visible in the tree: Another common mistake is to assume that the tips on tree you see include all taxa in the clade. In reality, taxa along the branches may be not shown because they are extinct or omitted for space. Also, the phyletic evolution that occurs along a branch is not usually included in the branching tree. Phyletic evolution is the evolutionary change along a branch that doesn’t result in speciation. Finally, the root connects the part of the tree that you see out to the rest of the “tree of life.” Any tree represents a minuscule subset of the tree of life. The image below shows the phylogenetic relationships among vertebrates, but it shows only one representative species for each group; for example, bony fish are not the only type of fish, but they are the only example shown on this tree to represent all fish. In addition, extinct species and phyletic evolution are represented within the branch patterns but are not visually represented on the tree.
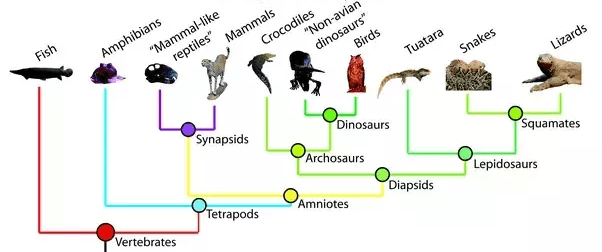
- Misconception: The longest branch shows the most “primitive” species. Another common error in interpreting trees is to assume that the taxon with the longest branch back to a node of common ancestry must be the most primitive taxon in the tree. In reality, none of the currently living taxa are any more “primitive” or any more “advanced” than any of the others; all the living taxa have all evolved for the same length of time from their most recent common ancestor. In the tree above, the Fish taxon has the longest branch. While it is tempting to think that fish are most “primitive,” or most like the common ancestor represented by the root node, there were undoubtedly many branches off that lineage during the course of evolution, most leading to extinct taxa (99% of all species are thought to have gone extinct), and many to living taxa that are just not shown in the tree. The tree is drawn with time on the vertical axis; the horizontal axis has no meaning and serves only to visually separate the taxa and their lineages.
- Misconception: Time runs along the angle of the branches, or across the tips. It is easy to misunderstand how time is represented in trees; in some cases it is incorrectly assumed that time is always oriented from “recent” at the top to “old” at the bottom. In other cases, it is incorrectly assumed that time runs at an angle if branches are shown running at an angle rather than horizontal or vertical, or across the tips from one taxon to another. In reality, phylogenetic trees can have different forms; they may be oriented sideways, inverted (most recent at bottom), or the branches may be curved, or the tree may be radial (oldest at the center). Regardless of how the tree is drawn, the tips are more recent in time, and the root is older in time; branching patterns all convey the same information: evolutionary ancestry and patterns of divergence.
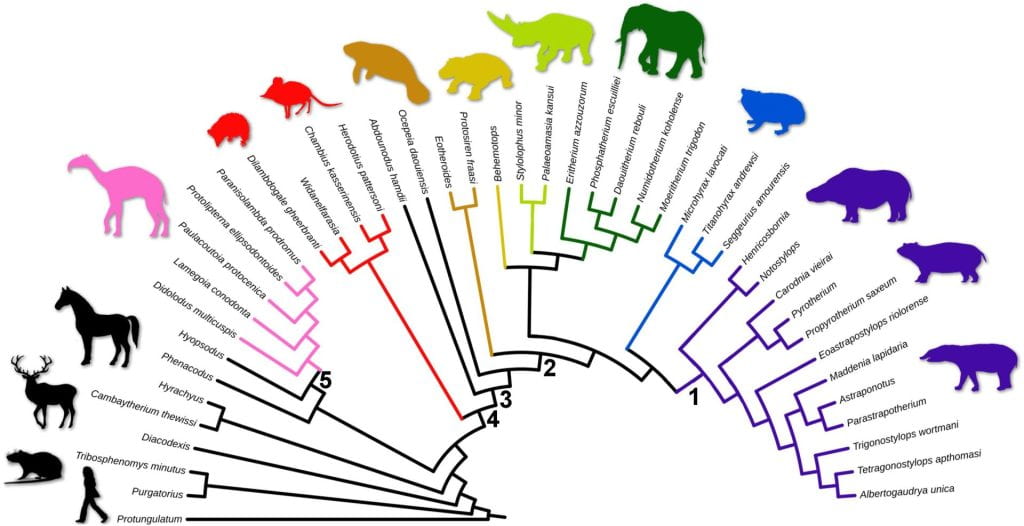
The image below shows a radial tree; time moves from the root to the arc, where the root is “old,” and all taxa represented by the tips along the arc are “recent” in the same time:
The image below shows two identical phylogenetic trees. In both trees, time runs vertically, with “older” at the bottom where the root is, and “more recent” at the top, where the tips are; time does NOT run at an angle in the tree on the left.

The vertebrate evolution phylogeny linked here shows time running from left to right, with the present day at the right. Because the phylogeny linked above overlays a timescale, it has a special term called an evogram. Notice also that in the phylogeny, some taxa are alive today (extant), but others are not (extinct); extinct taxa don’t extend to the present day, such as Tiktaalik in the center of the image. Key character states are indicated with small ticks along the branches. The immediate descendant has these shared, derived character states, and most of their descendants will have them as well, unless the traits are lost in a future branch of the lineage.
- Misconception: phylogenetic trees cannot be tested or revised. A final misconception we will discuss here is it is impossible to test or revise a phylogenetic tree. A phylogenetic tree represents a scientific hypothesis about how taxa are related to each other. That hypothesis is based on existing evidence such as genetic and morphological data. As with any hypothesis, a tree can be revised if biologists gain additional data that contradicts the current thinking. Therefore, we will likely see substantial uncertainty in some of the trees we work with in this module. Instead of feeling frustrated by this, consider that you are observing the scientific process in real time. We don’t always have answers, but we can always make a new hypothesis of how lineages arose and diversified.
Data Used in Constructing Phylogenetic Trees
As noted above, a phylogenetic tree represents a hypothesis about how taxa are related to each other, and that hypothesis is derived from existing evidence including data collected through observation of morphological or genetic traits. Morphological data include structural features, types of organs, and specific skeletal arrangements. Genetic data include mitochondrial DNA sequences, ribosomal RNA gene sequences, and any genomic genes of interest.
These types of data are used to identify homology, which means similarity due to common ancestry. In that same way that individuals inherit traits from their parents, homology indicates a shared, derived ancestry for a trait. For example,
- all humans have large brains and opposable thumbs because they inherited it from their ancestors.
- all mammals produce milk from mammary glands because they inherited it from their ancestors.
Trees are evolutionary hypotheses constructed on the principle of parsimony, which is the idea that the most likely branching pattern is the pattern that requires the fewest changes. For example, it is much more likely, or parsimonious, that all mammals produce milk because they all inherited mammary glands from a common ancestor that produced milk from mammary glands, versus the alternate hypothesis that mammary glands evolved independently in multiple lineages.
As with any hypothesis, a tree can be revised if biologists gain additional data that contradicts the current thinking. Therefore, we will likely see substantial uncertainty in some of the trees we work with in this module. Instead of feeling frustrated by this, consider that you are observing the scientific process in real time. We don’t always have answers, but we can always make a new hypothesis of how lineages arose and diversified.
Monophyletic Groups Share Derived Traits
As noted above, a group of taxa that includes a common ancestor and all of its descendants is called a monophyletic group, or a clade (“mono” = “one”). Example monophyletic groups we will discuss throughout this module include land plants, fungi, animals, vertebrates, and mammals, among others. A monophyletic group is defined by one or more shared, homologous, derived traits. A derived trait is a trait that a new trait that first appeared in the MCRA for that particular monophyletic group. For example, vertebrates, birds, and mammals are each a monophyletic group; the presence of a vertebral column is a derived trait among vertebrates, the presence of feathers is a derived trait among birds, and the presence of hair is a derived trait among mammals.
Non-monophyletic groups either exclude one or more descendants or exclude the common ancestor; non-monophyletic groups are not clades. The image below differentiates between monophyletic groups (clades) and non-monophyletic groups.
Using MRCA to Evaluate Relatedness Among Taxa
Phylogenetic trees illustrate the relatedness among taxa; the more recently two taxa shared a common ancestor, the more closely related they are. Let’s return to the example phylogeny we introduced at the start of this reading to work through this concept:
The root node represents the most recent common ancestor (MRCA) of all of the taxa represented on the tree. Time in this particular style of tree is represented vertically, proceeding bottom to top. To determine how closely related two taxa are, first identify the two taxa of interest, and then work backward through time to locate the MRCA for these two taxa. For the tree above, we see that taxon A and taxon B are more closely related to each other than either taxon is to taxon C. The reason is that taxon A and taxon B share a more recent common ancestor than A and B do with taxon C. In other words, the MCRA of taxon A and taxon C is older than the MRCA of taxon A and taxon B.
Adaptive Radiations Result in Rapid Diversification of New Species
Adaptive radiations are periods of increasing biodiversity and rapid speciation in geologic time. (“Rapid” in geologic time means “millions of years.”) In a phylogenetic tree, an adaptive radiation often looks “tufty,” like the tip of a paintbrush, with lots of short bristles (branches) coming off a longer branch. There are multiple situations which can promote an adaptive radiation:
- When new ecological niches become available, which can occur after a major climate event like the oxygen revolution or after a mass extinction. An example is when all non-avian dinosaurs went extinct at the end-Cretaceous mass extinction, which allowed the surviving mammals to diversify into the niches that had previously been occupied by dinosaurs; the dinosaurs were no longer present to outcompete the mammals.
- In response to a key “evolutionary innovation” which is a novel (new) derived adaptive trait that in the environment. Examples include traits like jaws, multicellularity, wings, nectar in flowers, or flat molars (which allow for chewing) in mammals. Each of these opens up newly available resources to the individuals with the trait. For example, the evolution of jaws gave early gnathostomes the ability to bite other organisms, which opened up an array of available prey items.
Additional Resources
Here is an excellent resource on phylogenetic trees for more information: Understanding Evolution: the Tree Room
If you notice that you would benefit from more practice reading trees and reviewing tree thinking, the following video is a great review to tree thinking:
